Suggested Videos
Part 5 - ASP.NET Chart DataSource
Part 6 - Chart.DataBindTable Example
Part 7 - 3D Charts in ASP.NET
In this video we will discuss binding XML file to ASP.NET Chart control.
Step 1 : Add an XML file to the project. Name it Students.xml. Copy and paste the following XML.
Step 2 : Drag and Drop a Chart Control on the WebForm.
Step 3 : Copy and paste the following code in the code-behind file.
Step 4 : Run the application. The XML data should be displayed in a column chart as shown below.

Part 5 - ASP.NET Chart DataSource
Part 6 - Chart.DataBindTable Example
Part 7 - 3D Charts in ASP.NET
In this video we will discuss binding XML file to ASP.NET Chart control.
Step 1 : Add an XML file to the project. Name it Students.xml. Copy and paste the following XML.
<?xml version="1.0" encoding="utf-8" ?>
<Students>
<Student>
<ID>1</ID>
<StudentName>Mark</StudentName>
<TotalMarks>800</TotalMarks>
</Student>
<Student>
<ID>2</ID>
<StudentName>Steve</StudentName>
<TotalMarks>900</TotalMarks>
</Student>
<Student>
<ID>3</ID>
<StudentName>John</StudentName>
<TotalMarks>700</TotalMarks>
</Student>
<Student>
<ID>4</ID>
<StudentName>Mary</StudentName>
<TotalMarks>900</TotalMarks>
</Student>
<Student>
<ID>5</ID>
<StudentName>Ben</StudentName>
<TotalMarks>600</TotalMarks>
</Student>
</Students>
Step 2 : Drag and Drop a Chart Control on the WebForm.
Step 3 : Copy and paste the following code in the code-behind file.
using System;
using System.Data;
namespace ChartsDemo
{
public partial class
WebForm1 : System.Web.UI.Page
{
protected void Page_Load(object sender,
EventArgs e)
{
DataSet ds = new DataSet();
// Read the data from XML file into
DataSet
ds.ReadXml(Server.MapPath("~/Students.xml"));
// Specify the column that contains
values for X-AXIS
Chart1.Series["Series1"].XValueMember
= "StudentName";
// Specify the column that contains
values for Y-AXIS
Chart1.Series["Series1"].YValueMembers
= "TotalMarks";
// Set DataSet as the DataSource for
the Chart control
Chart1.DataSource = ds;
// Finally call DataBind
Chart1.DataBind();
}
}
}
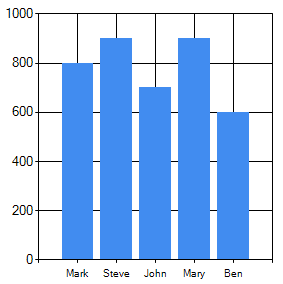
Step 4 : Run the application. The XML data should be displayed in a column chart as shown below.
No comments:
Post a Comment
It would be great if you can help share these free resources