Suggested Videos
Part 4 - How to bind data from database to chart control in asp.net
Part 5 - ASP.NET Chart DataSource
Part 6 - Chart.DataBindTable Example
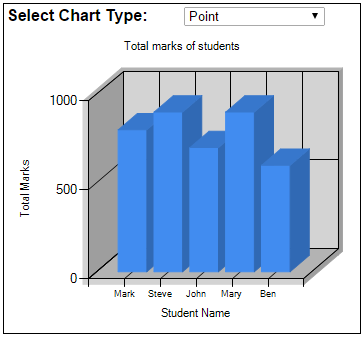
In this video we will discuss creating 3 Dimensional charts in ASP.NET. This is continuation to Part 6. Please watch Part 6 before proceeding.
ASP.NET chart control supports 3D charts. To use 3D charts, set the respective chart area's Area3DStyle.Enable3D property to True.
Run the application and notice that a 3D chart is created.
Customizing the look and feel of 3D charts :
Now flip WebForm1.aspx to Design mode. Notice, nothing is displayed in the chart control. This is because the chart control does not contain any series element. If you recollect from the previous video session we deleted the "Series1" element from the chart control. To see the different 3D properties available and the impact these properties can have on 3D charts, include a series element in the HTML of the chart control.
At this point the HTML of the Chart control should be as shown below.
Flip WebForm1.aspx to Design mode. In the properties window of the chart control, click the ellipsis button next to ChartAreas property. In the window that pops up, you will find the 3D charts related properties.

As you change these property values, you can see their effect on the 3D chart at design time. When you click on a property, at the bottom of the window you can see help text for that property.
Before you run the project, make sure to delete "Series1" element from the chart control, otherwise you would get the following run time exception when you try to select a different chart type from the DropDownList.
Chart Area Axes - The chart area contains incompatible chart types. For example, bar charts and column charts cannot exist in the same chart area.

Part 4 - How to bind data from database to chart control in asp.net
Part 5 - ASP.NET Chart DataSource
Part 6 - Chart.DataBindTable Example
In this video we will discuss creating 3 Dimensional charts in ASP.NET. This is continuation to Part 6. Please watch Part 6 before proceeding.
ASP.NET chart control supports 3D charts. To use 3D charts, set the respective chart area's Area3DStyle.Enable3D property to True.
<ChartAreas>
<asp:ChartArea Name="ChartArea1">
<AxisX Title="Student Name">
</AxisX>
<AxisY Title="Total Marks">
</AxisY>
<Area3DStyle Enable3D="true"/>
</asp:ChartArea>
</ChartAreas>
Run the application and notice that a 3D chart is created.
Customizing the look and feel of 3D charts :
Now flip WebForm1.aspx to Design mode. Notice, nothing is displayed in the chart control. This is because the chart control does not contain any series element. If you recollect from the previous video session we deleted the "Series1" element from the chart control. To see the different 3D properties available and the impact these properties can have on 3D charts, include a series element in the HTML of the chart control.
At this point the HTML of the Chart control should be as shown below.
<asp:Chart ID="Chart1" runat="server" Width="350px">
<Titles>
<asp:Title Text="Total marks of students">
</asp:Title>
</Titles>
<Series>
<asp:Series Name="Series1" ChartArea="ChartArea1">
</asp:Series>
</Series>
<ChartAreas>
<asp:ChartArea Name="ChartArea1">
<AxisX Title="Student Name">
</AxisX>
<AxisY Title="Total Marks">
</AxisY>
<Area3DStyle Enable3D="True" />
</asp:ChartArea>
</ChartAreas>
</asp:Chart>
Flip WebForm1.aspx to Design mode. In the properties window of the chart control, click the ellipsis button next to ChartAreas property. In the window that pops up, you will find the 3D charts related properties.
As you change these property values, you can see their effect on the 3D chart at design time. When you click on a property, at the bottom of the window you can see help text for that property.
Before you run the project, make sure to delete "Series1" element from the chart control, otherwise you would get the following run time exception when you try to select a different chart type from the DropDownList.
Chart Area Axes - The chart area contains incompatible chart types. For example, bar charts and column charts cannot exist in the same chart area.
I am unable to download the image,by moving the image in a new tab also
ReplyDelete