Suggested Videos
Part 104 - Difference between cube and rollup in SQL Server
Part 105 - Grouping function in SQL Server
Part 106 - Grouping_Id function in SQL Server
In this video we will discuss how to debug stored procedures in SQL Server.
Setting up the Debugger in SSMS : If you have connected to SQL Server using (local) or . (period), and when you start the debugger you will get the following error
Unable to start T-SQL Debugging. Could not connect to computer.

To fix this error, use the computer name to connect to the SQL Server instead of using (local) or .
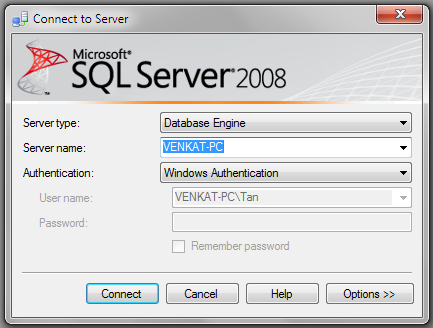
For the examples in this video we will be using the following stored procedure.
Connect to SQL Server using your computer name, and then execute the above code to create the stored procedure. At this point, open a New Query window. Copy and paste the following T-SQL code to execute the stored procedure.
Starting the Debugger in SSMS : There are 2 ways to start the debugger
1. In SSMS, click on the Debug Menu and select Start Debugging
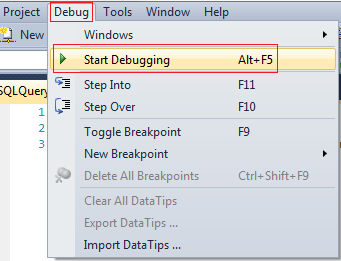
2. Use the keyboard shortcut ALT + F5
At this point you should have the debugger running. The line that is about to be executed is marked with an yellow arrow

Step Over, Step into and Step Out in SSMS : You can find the keyboard shortcuts in the Debug menu in SSMS.

Let us understand what Step Over, Step into and Step Out does when debugging the following piece of code

1. There is no difference when you STEP INTO (F11) or STEP OVER (F10) the code on LINE 2
2. On LINE 3, we are calling a Stored Procedure. On this statement if we press F10 (STEP OVER), it won't give us the opportunity to debug the stored procedure code. To be able to debug the stored procedure code you will have to STEP INTO it by pressing F11.
3. If the debugger is in the stored procedure, and you don't want to debug line by line with in that stored procedure, you can STEP OUT of it by pressing SHIFT + F11. When you do this, the debugger completes the execution of the stored procedure and waits on the next line in the main query, i.e on LINE 4 in this example.
To stop debugging : There are 2 ways to stop debugging
1. In SSMS, click on the Debug Menu and select Stop Debugging
2. Use the keyboard shortcut SHIFT + F5
Show Next Statement shows the next statement that the debugger is about to execute.
Run to Cursor command executes all the statements in a batch up to the current cursor position
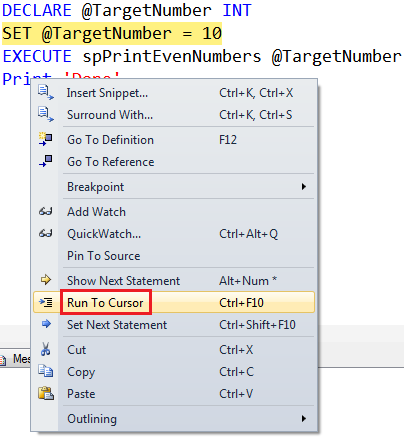
Locals Window in SSMS : Displays the current values of variables and parameters

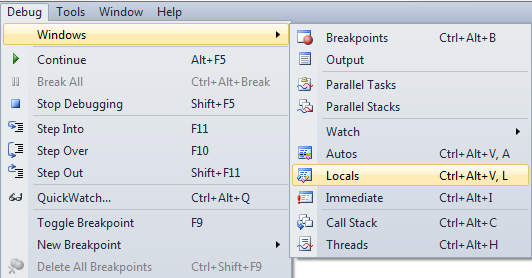
If you cannot see the locals window or if you have closed it and if you want to open it, you can do so using the following menu option. Locals window is only available if you are in DEBUG mode.
Watch Window in SSMS : Just like Locals window, Watch window is used to watch the values of variables. You can add and remove variables from the watch window. To add a variable to the Watch Window, right click on the variable and select "Add Watch" option from the context menu.

Call Stack Window in SSMS : Allows you to navigate up and down the call stack to see what values your application is storing at different levels. It's an invaluable tool for determining why your code is doing what it's doing.

Immediate Window in SSMS : Very helpful during debugging to evaluate expressions, and print variable values. To clear immediate window type >cls and press enter.

Breakpoints in SSMS : There are 2 ways to set a breakpoint in SSMS.
1. By clicking on the grey margin on the left hand side in SSMS (to remove click again)
2. By pressing F9 (to remove press F9 again)
Enable, Disable or Delete all breakpoints : There are 2 ways to Enable, Disable or Delete all breakpoints
1. From the Debug menu
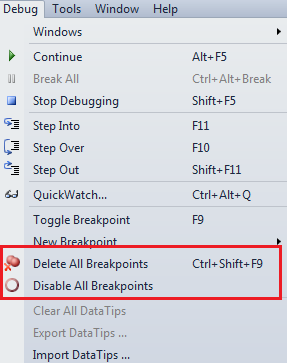
2. From the Breakpoints window. To view Breakpoints window select Debug => Windows => Breakpoints or use the keyboard shortcut ALT + CTRL + B

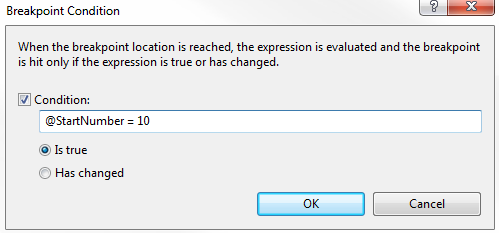
Conditional Breakpoint : Conditional Breakpoints are hit only when the specified condition is met. These are extremely useful when you have some kind of a loop and you want to break, only when the loop variable has a specific value (For example loop varible = 100).
How to set a conditional break point in SSMS :
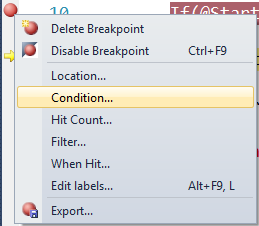
1. Right click on the Breakpoint and select Condition from the context menu
2. In the Breakpoint window specify the condition

Part 104 - Difference between cube and rollup in SQL Server
Part 105 - Grouping function in SQL Server
Part 106 - Grouping_Id function in SQL Server
In this video we will discuss how to debug stored procedures in SQL Server.
Setting up the Debugger in SSMS : If you have connected to SQL Server using (local) or . (period), and when you start the debugger you will get the following error
Unable to start T-SQL Debugging. Could not connect to computer.

To fix this error, use the computer name to connect to the SQL Server instead of using (local) or .

For the examples in this video we will be using the following stored procedure.
Create procedure spPrintEvenNumbers
@Target int
as
Begin
Declare @StartNumber int
Set @StartNumber = 1
while(@StartNumber < @Target)
Begin
If(@StartNumber%2 = 0)
Begin
Print @StartNumber
End
Set @StartNumber = @StartNumber + 1
End
Print 'Finished printing even
numbers till ' + RTRIM(@Target)
End
Connect to SQL Server using your computer name, and then execute the above code to create the stored procedure. At this point, open a New Query window. Copy and paste the following T-SQL code to execute the stored procedure.
DECLARE @TargetNumber INT
SET @TargetNumber = 10
EXECUTE spPrintEvenNumbers @TargetNumber
Print 'Done'
Starting the Debugger in SSMS : There are 2 ways to start the debugger
1. In SSMS, click on the Debug Menu and select Start Debugging

2. Use the keyboard shortcut ALT + F5
At this point you should have the debugger running. The line that is about to be executed is marked with an yellow arrow

Step Over, Step into and Step Out in SSMS : You can find the keyboard shortcuts in the Debug menu in SSMS.

Let us understand what Step Over, Step into and Step Out does when debugging the following piece of code

1. There is no difference when you STEP INTO (F11) or STEP OVER (F10) the code on LINE 2
2. On LINE 3, we are calling a Stored Procedure. On this statement if we press F10 (STEP OVER), it won't give us the opportunity to debug the stored procedure code. To be able to debug the stored procedure code you will have to STEP INTO it by pressing F11.
3. If the debugger is in the stored procedure, and you don't want to debug line by line with in that stored procedure, you can STEP OUT of it by pressing SHIFT + F11. When you do this, the debugger completes the execution of the stored procedure and waits on the next line in the main query, i.e on LINE 4 in this example.
To stop debugging : There are 2 ways to stop debugging
1. In SSMS, click on the Debug Menu and select Stop Debugging
2. Use the keyboard shortcut SHIFT + F5
Show Next Statement shows the next statement that the debugger is about to execute.
Run to Cursor command executes all the statements in a batch up to the current cursor position

Locals Window in SSMS : Displays the current values of variables and parameters

If you cannot see the locals window or if you have closed it and if you want to open it, you can do so using the following menu option. Locals window is only available if you are in DEBUG mode.

Watch Window in SSMS : Just like Locals window, Watch window is used to watch the values of variables. You can add and remove variables from the watch window. To add a variable to the Watch Window, right click on the variable and select "Add Watch" option from the context menu.

Call Stack Window in SSMS : Allows you to navigate up and down the call stack to see what values your application is storing at different levels. It's an invaluable tool for determining why your code is doing what it's doing.

Immediate Window in SSMS : Very helpful during debugging to evaluate expressions, and print variable values. To clear immediate window type >cls and press enter.

Breakpoints in SSMS : There are 2 ways to set a breakpoint in SSMS.
1. By clicking on the grey margin on the left hand side in SSMS (to remove click again)
2. By pressing F9 (to remove press F9 again)
Enable, Disable or Delete all breakpoints : There are 2 ways to Enable, Disable or Delete all breakpoints
1. From the Debug menu

2. From the Breakpoints window. To view Breakpoints window select Debug => Windows => Breakpoints or use the keyboard shortcut ALT + CTRL + B

Conditional Breakpoint : Conditional Breakpoints are hit only when the specified condition is met. These are extremely useful when you have some kind of a loop and you want to break, only when the loop variable has a specific value (For example loop varible = 100).
How to set a conditional break point in SSMS :
1. Right click on the Breakpoint and select Condition from the context menu

2. In the Breakpoint window specify the condition


Hi Venkat Sir,
ReplyDeleteThank you so much for keep posting videos on sqlserver.Can you please tell me how to pass mutiple values as parameters to a stored procedure(say 1000).This is one my interview questions.
Thanks in advance
Hi Sir,
ReplyDeleteThank you so much for keep on posting the videos on sqlserver.Can you please record the video for passing multiple values to stored procedure(say 1000).This is one of my interview questions.
Thnaks in advance
I am not exactly sure but by referring previous videos i think it can be done by passing table valued variable to procedure.
Deletecreate type tableValuedVariable as table
(x int,
y int
)
create procedure SP_XYAB
@tv tableValuedVariable readonly
as
begin
select * into bckUp from @tv
-- insert into select * from @tv
end
declare @tvV1 tableValuedVariable
insert into @tvV1 values (1,2)
-- insert as many you want
execute SP_XYAB @tvV1